> ## Documentation Index
> Fetch the complete documentation index at: https://docs.getprova.com/llms.txt
> Use this file to discover all available pages before exploring further.
# CPM Report
> Learn how to use the CPM report to benchmark paid media reach efficiency, compare channels, and see how current CPM trends compare with the prior year.
## Overview
The CPM report shows how efficiently your paid media budget is buying reach.
CPM stands for cost per 1,000 impressions. In Provalytics, this report turns that basic metric into a more useful planning and benchmarking view by combining:
* blended CPM
* channel-level CPM
* trend over time
* prior-year comparison
## What you can do
In the CPM report, you can:
* Review blended CPM for the selected time window
* See current CPM trend over time
* Compare current CPM against the prior-year period
* Compare CPM by channel
* Review impression share by channel
This report is helpful when the question is not:
> Did the channel convert?
but:
> How efficiently are we buying audience reach?
## What the page looks like in practice
The CPM report is easiest to understand as two connected views:
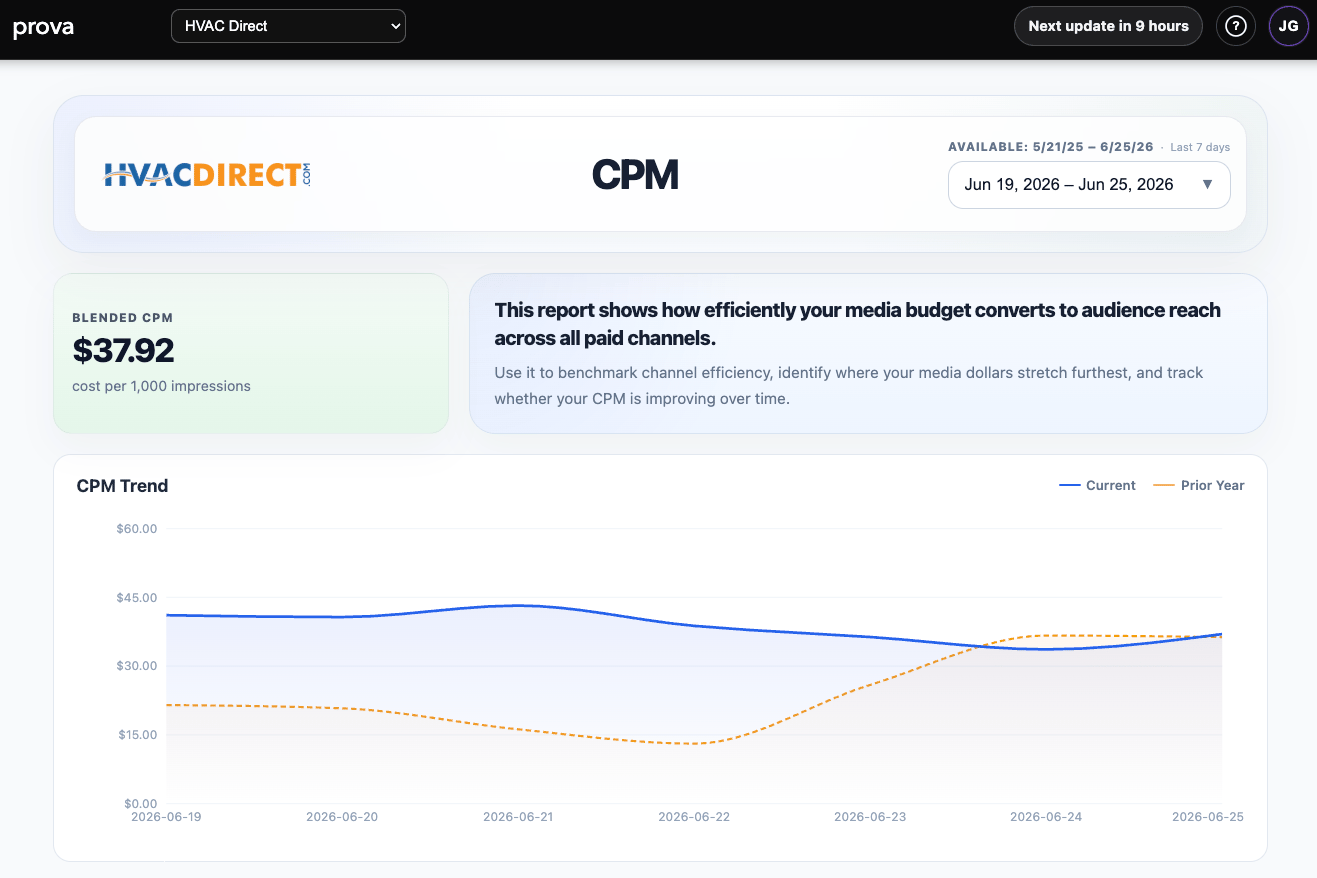
### Overview view
The top-level page gives you:
* a blended CPM card
* a short explanation of what the report is measuring
* a current-versus-prior-year trend view
This is the best starting point when you want a fast answer to whether audience reach is getting more or less expensive.
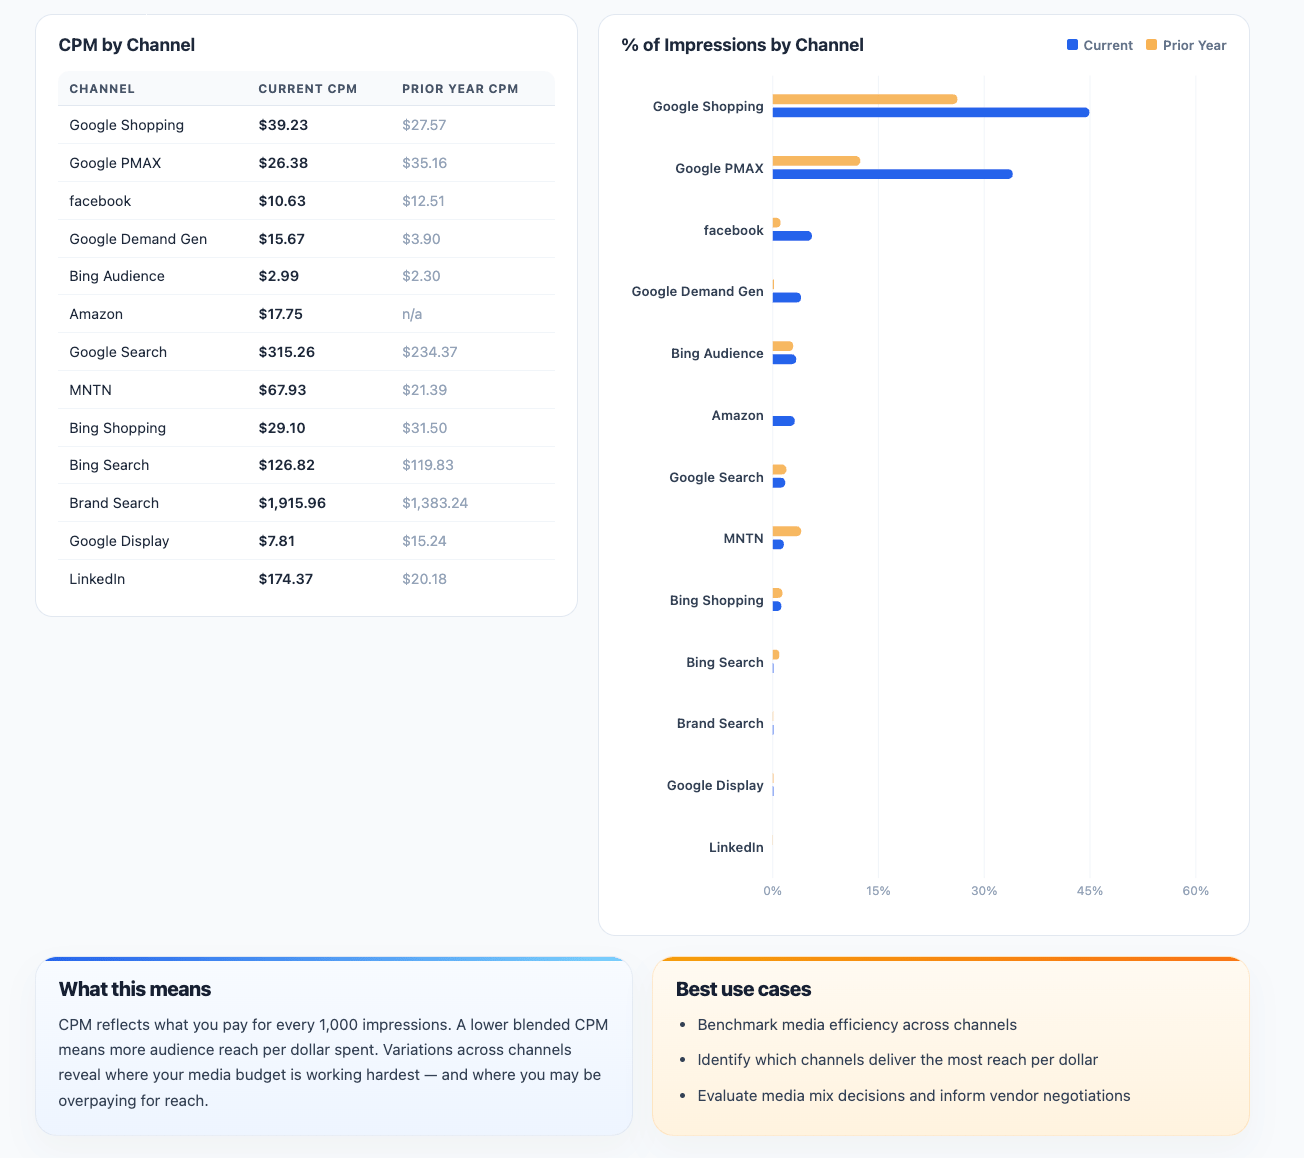
 ### Detail view
The lower-level view expands into:
* a table comparing current CPM vs prior-year CPM by channel
* a chart showing each channel’s share of impressions
That makes it easier to see where your cheapest or most expensive reach is coming from and how the mix has changed.
### Detail view
The lower-level view expands into:
* a table comparing current CPM vs prior-year CPM by channel
* a chart showing each channel’s share of impressions
That makes it easier to see where your cheapest or most expensive reach is coming from and how the mix has changed.
 ## What the report is showing
The report gives you three useful lenses:
### Blended CPM
This is the overall paid media CPM across the selected period.
It helps teams understand whether media costs are generally becoming more or less efficient from a reach perspective.
### CPM Trend
This view shows how CPM is moving over time.
That makes it easier to spot:
* rising media costs
* seasonal cost shifts
* short-term efficiency improvement or deterioration
### CPM by Channel
This shows how expensive each channel is relative to the impressions it delivers, with a current-period view and prior-year comparison.
That helps reveal where your budget is stretching furthest and where reach may be getting more expensive than expected.
## How to interpret it well
A lower CPM usually means more reach per dollar.
But lower CPM does not automatically mean better business performance.
A practical reading rule is:
* use CPM to understand reach efficiency
* use incrementality and efficiency reports to understand business impact
That distinction matters because some channels are worth paying more for if they drive stronger downstream impact.
## What this report is best for
CPM is most useful for:
* benchmarking paid media cost efficiency
* media mix reviews
* vendor and platform cost conversations
* identifying whether reach is getting more expensive over time
* comparing current economics with the prior year
It is especially valuable in planning conversations where teams need to understand whether a reach-based channel is becoming more or less expensive before deciding how much budget to allocate.
## Important interpretation note
CPM is a cost-of-reach metric, not a proof-of-impact metric.
Use it together with:
* [Incrementality Report](/using-provalytics/incrementality-report)
* [Campaign Performance](/using-provalytics/campaign-performance)
* [Spend Headroom](/using-provalytics/spend-headroom)
That way you can judge both:
* what audience exposure costs
* and whether that exposure is creating meaningful business results
## What the report is showing
The report gives you three useful lenses:
### Blended CPM
This is the overall paid media CPM across the selected period.
It helps teams understand whether media costs are generally becoming more or less efficient from a reach perspective.
### CPM Trend
This view shows how CPM is moving over time.
That makes it easier to spot:
* rising media costs
* seasonal cost shifts
* short-term efficiency improvement or deterioration
### CPM by Channel
This shows how expensive each channel is relative to the impressions it delivers, with a current-period view and prior-year comparison.
That helps reveal where your budget is stretching furthest and where reach may be getting more expensive than expected.
## How to interpret it well
A lower CPM usually means more reach per dollar.
But lower CPM does not automatically mean better business performance.
A practical reading rule is:
* use CPM to understand reach efficiency
* use incrementality and efficiency reports to understand business impact
That distinction matters because some channels are worth paying more for if they drive stronger downstream impact.
## What this report is best for
CPM is most useful for:
* benchmarking paid media cost efficiency
* media mix reviews
* vendor and platform cost conversations
* identifying whether reach is getting more expensive over time
* comparing current economics with the prior year
It is especially valuable in planning conversations where teams need to understand whether a reach-based channel is becoming more or less expensive before deciding how much budget to allocate.
## Important interpretation note
CPM is a cost-of-reach metric, not a proof-of-impact metric.
Use it together with:
* [Incrementality Report](/using-provalytics/incrementality-report)
* [Campaign Performance](/using-provalytics/campaign-performance)
* [Spend Headroom](/using-provalytics/spend-headroom)
That way you can judge both:
* what audience exposure costs
* and whether that exposure is creating meaningful business results