Overview
Campaign Performance is where Provalytics moves from channel-level measurement into the structure inside the channel. Use it to answer questions like:- which sub-channels or campaign groups are driving the result?
- where inside a channel is budget working hardest?
- which campaign group is consuming spend without delivering proportional impact?
What the report does
Campaign Performance breaks a channel into hierarchy rows and shows contribution, share, cost, and efficiency at each level. Depending on the channel structure and the mapping available for that client, the report can move through levels such as:- channel
- sub-channel
- campaign group
- campaign
- ad set or other detailed hierarchy row
How to use the report
The best workflow is:- start at the parent channel
- review its trend and headline totals
- open the hierarchy table
- drill into the strongest or weakest rows
- compare contribution against cost and efficiency
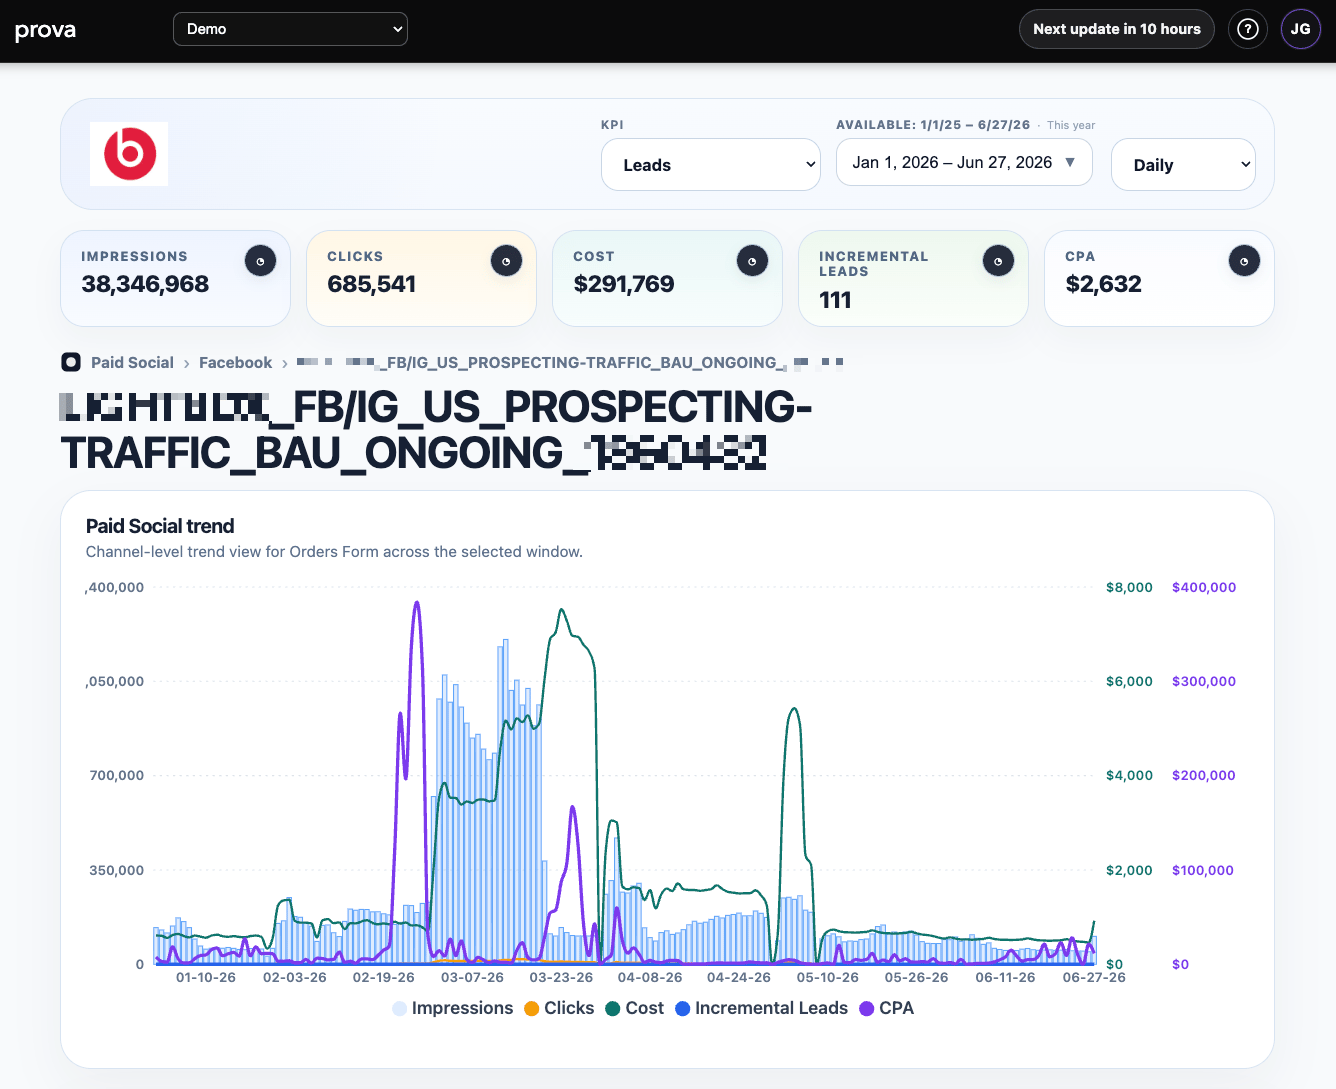
Step 1: Start at the channel view
The top of the page gives you the same key controls you see elsewhere:- KPI
- date range
- grain
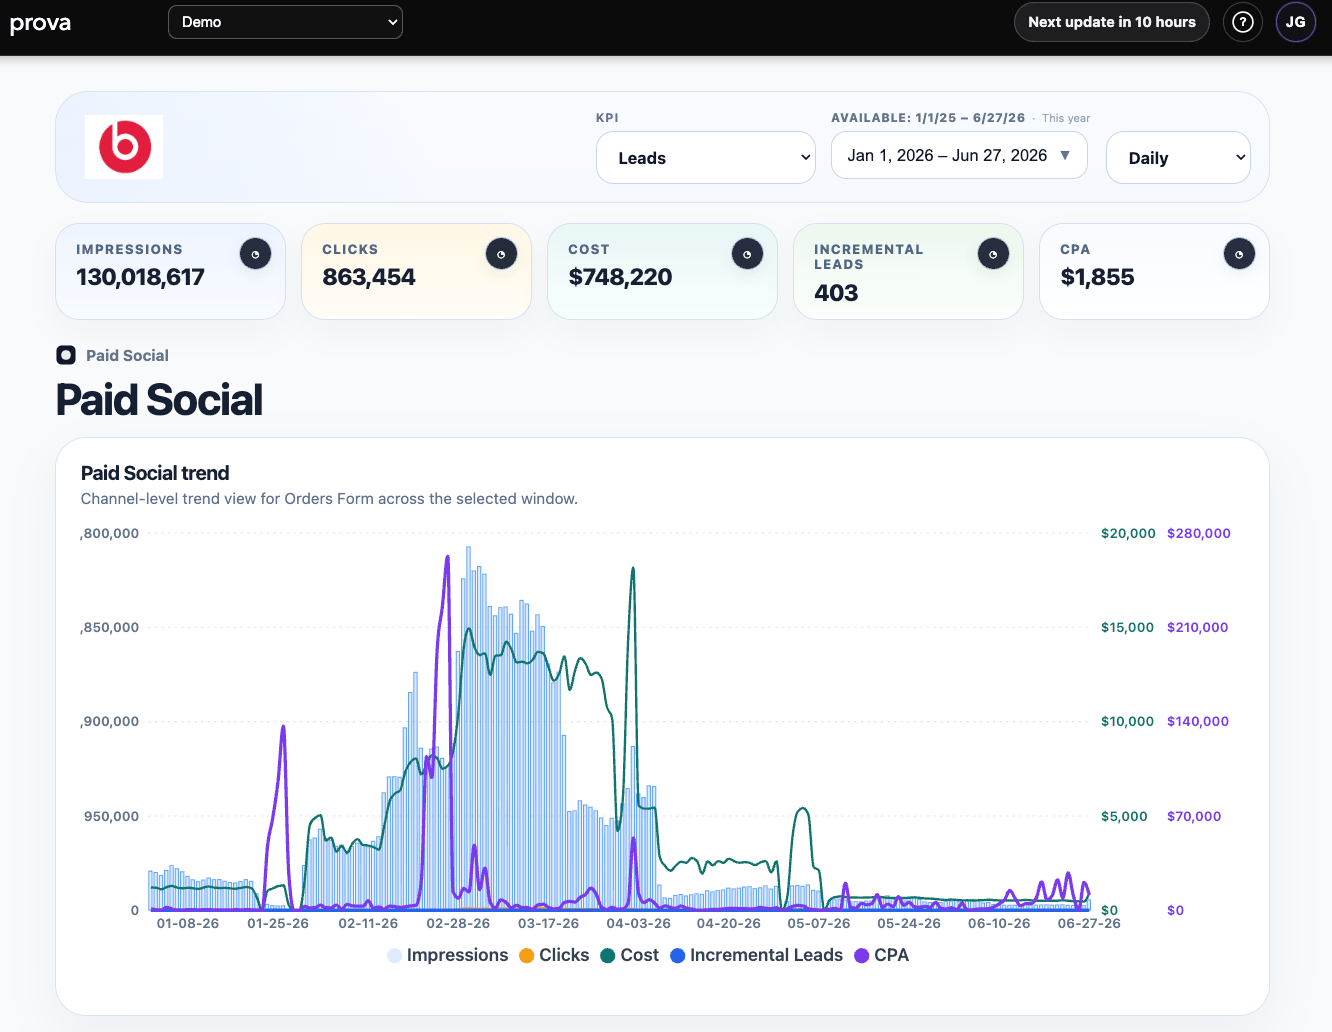
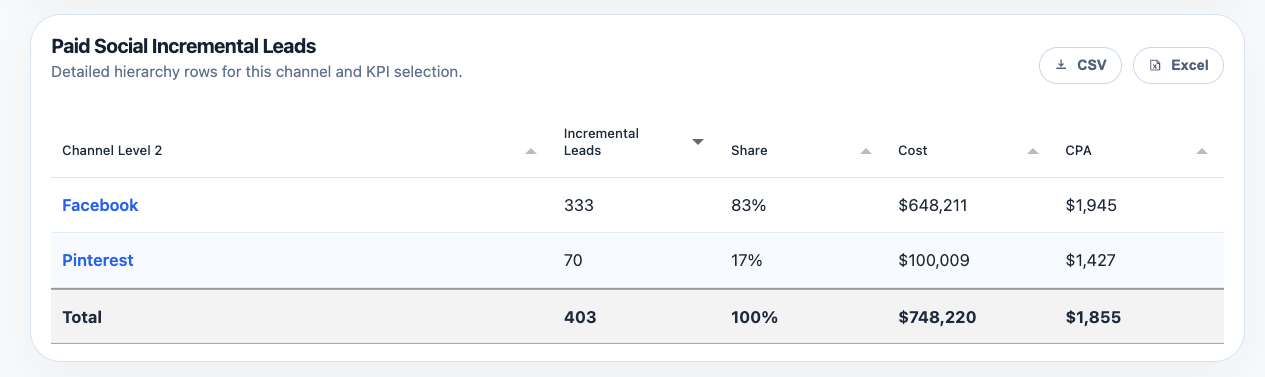
Step 2: Review the first hierarchy table
The first table level typically shows the major components inside the channel. In this example,Paid Social is broken into Facebook and Pinterest, with:
- incremental contribution
- share
- cost
- CPA
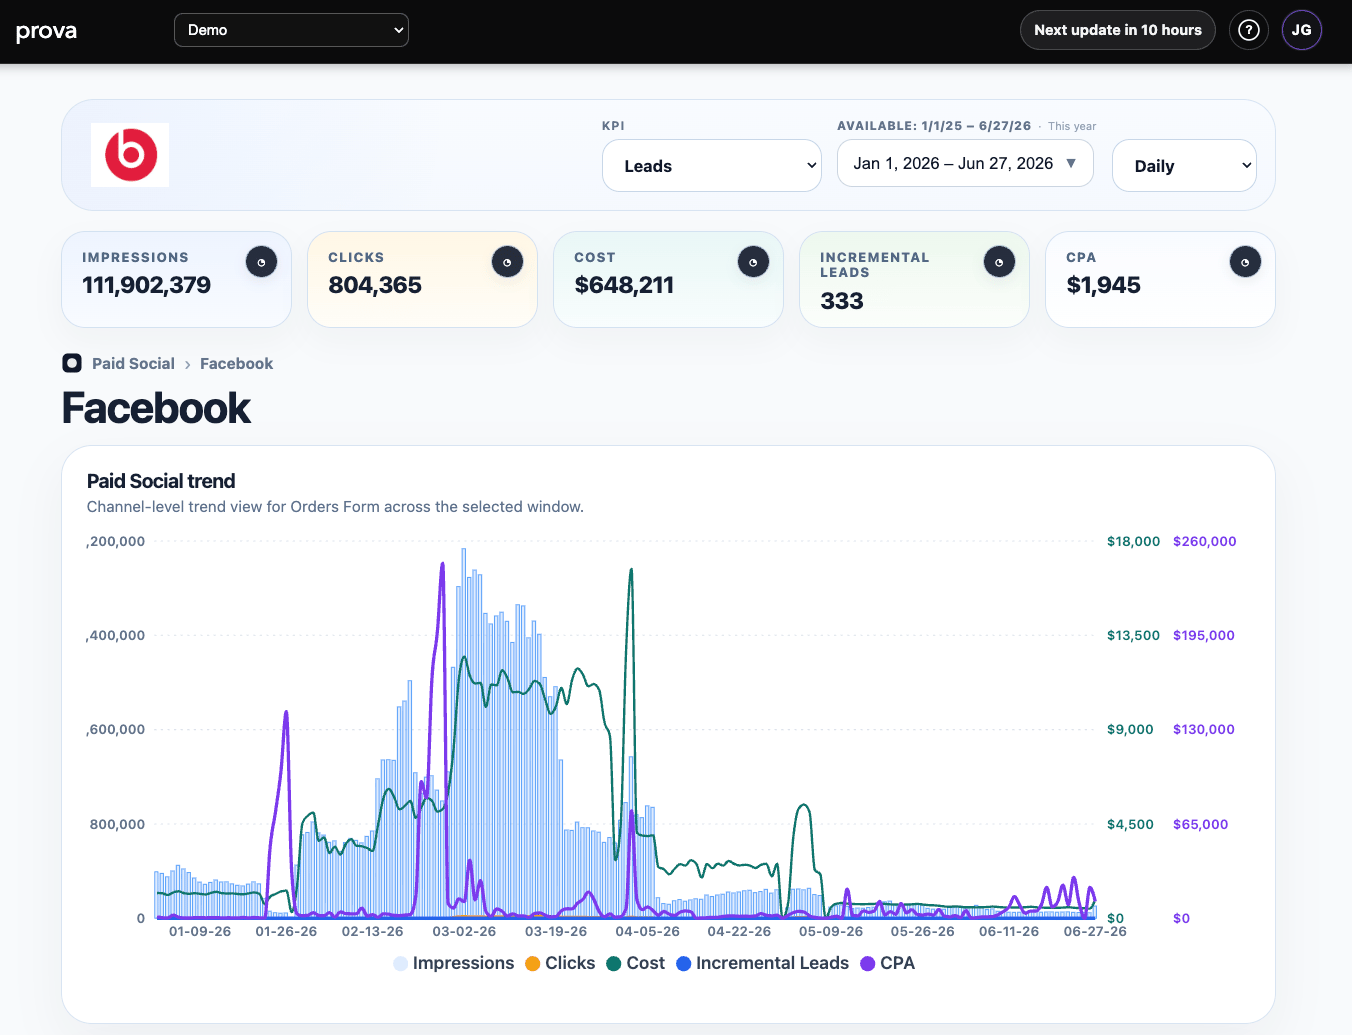
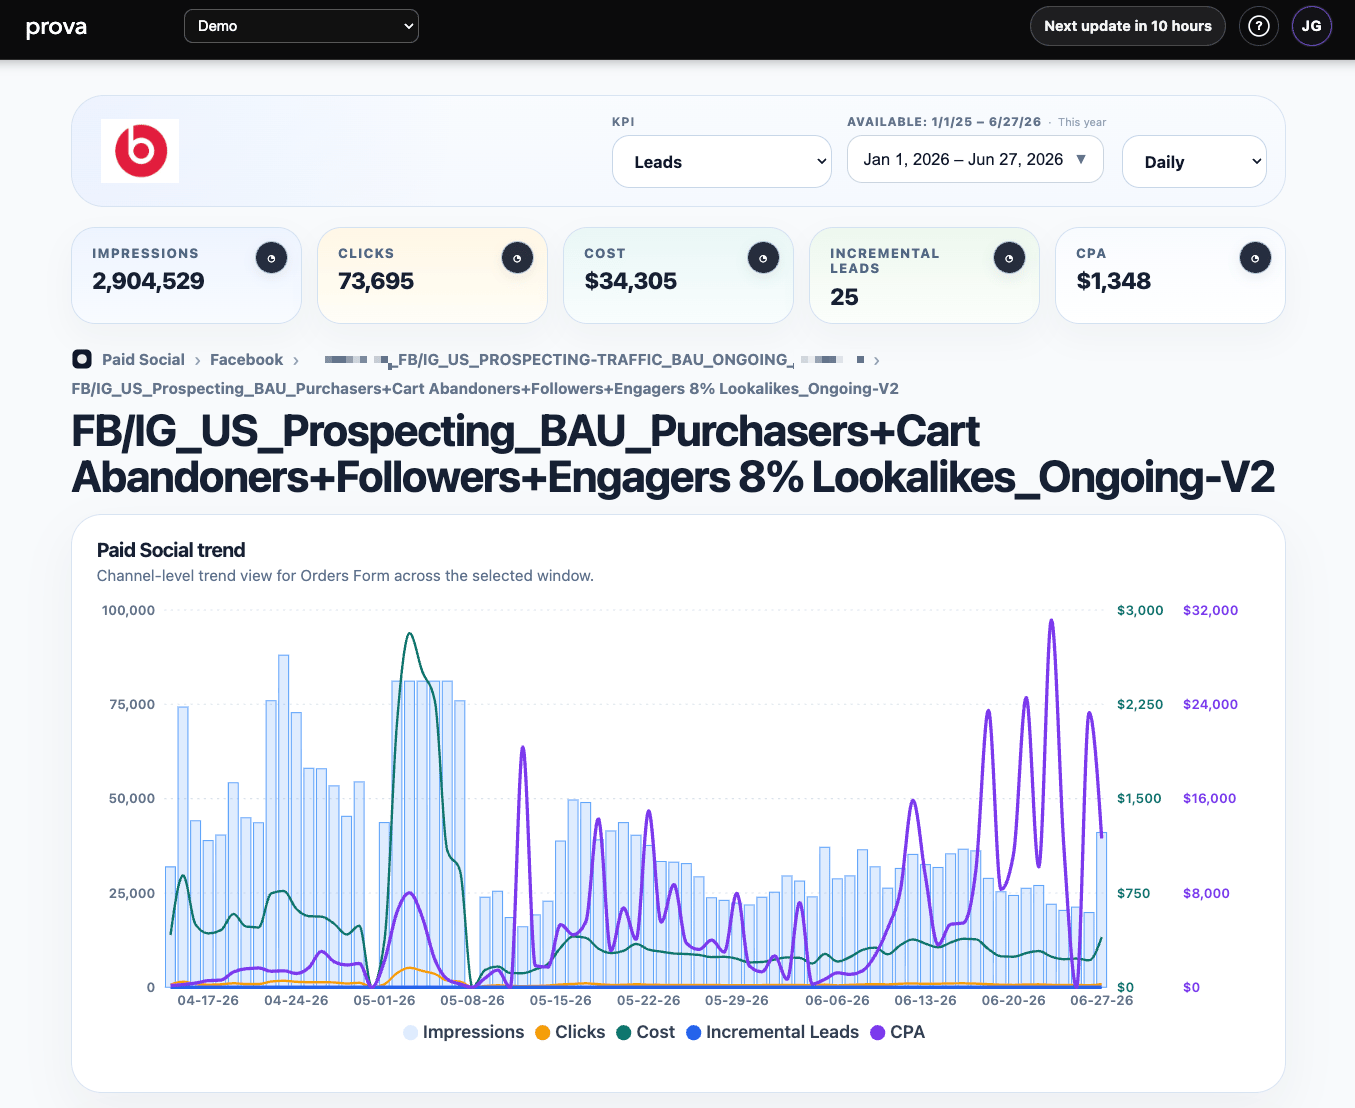
Step 3: Drill into a sub-channel
Once you click into a row such asFacebook, the page keeps the same structure:
- summary cards
- trend chart
- detailed hierarchy table
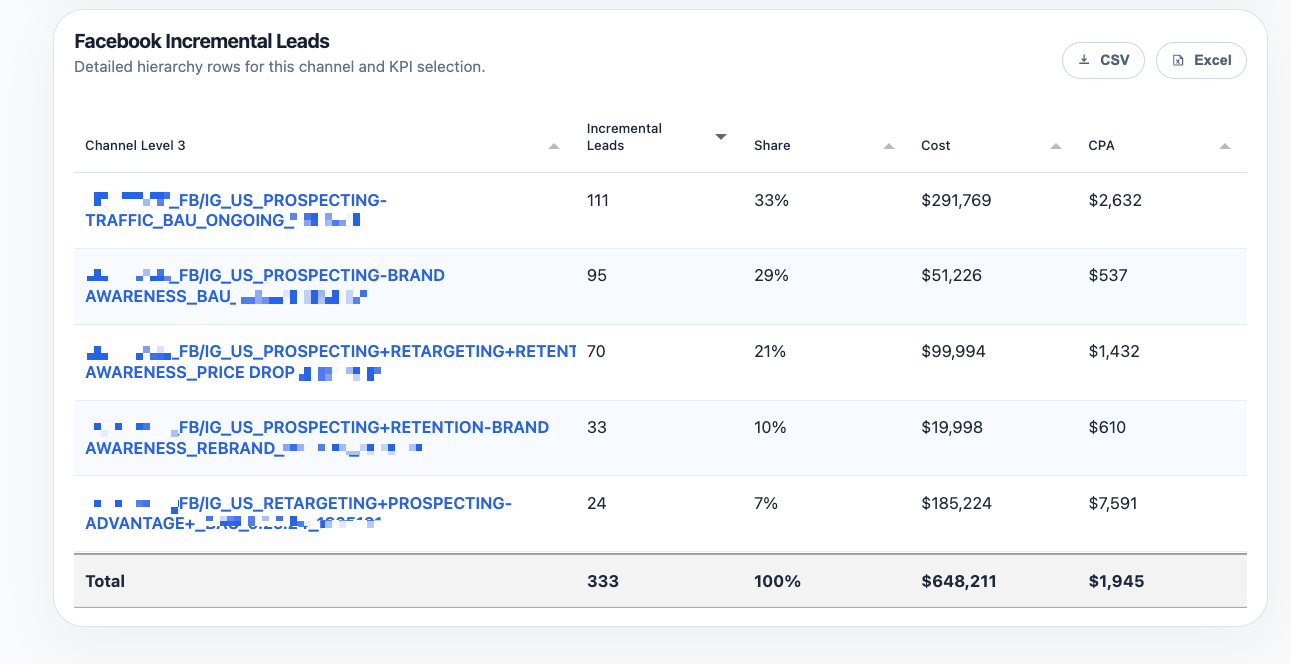
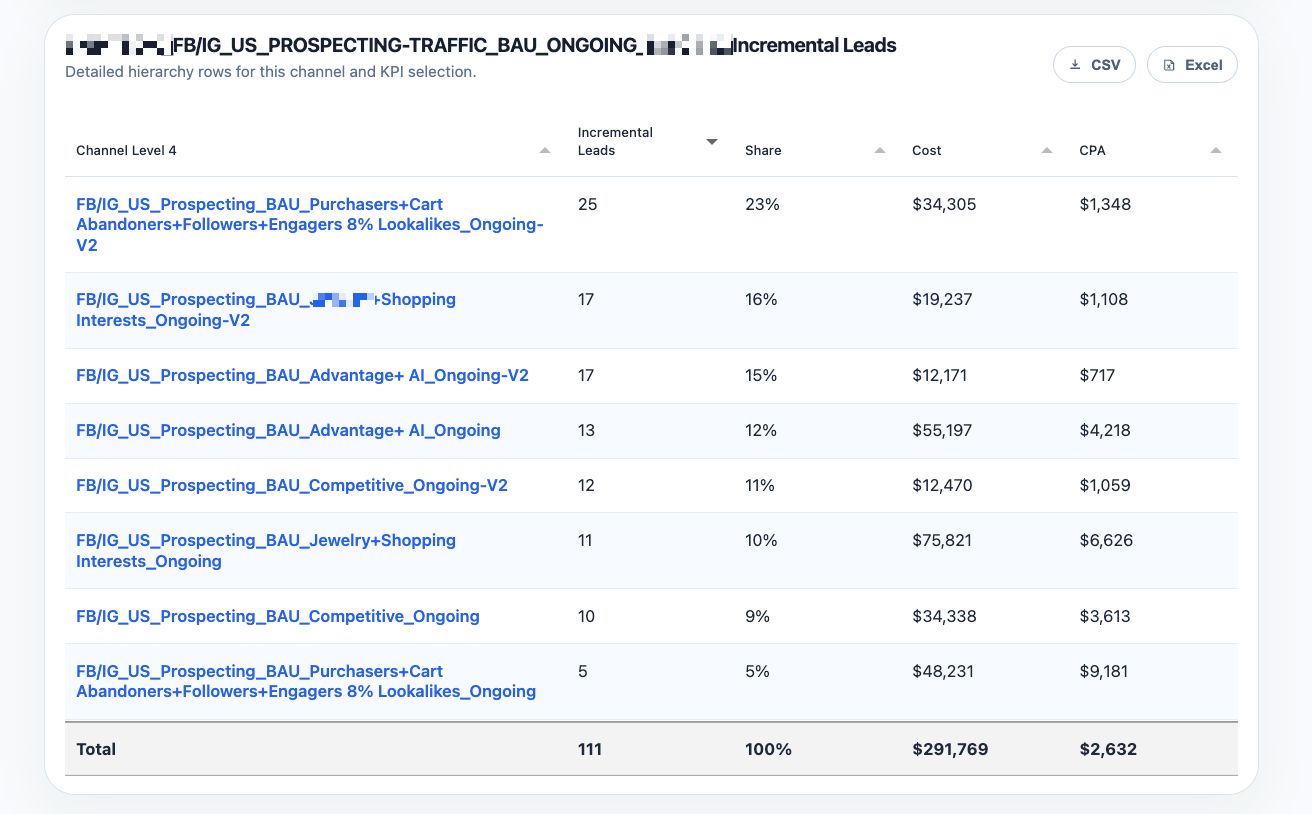
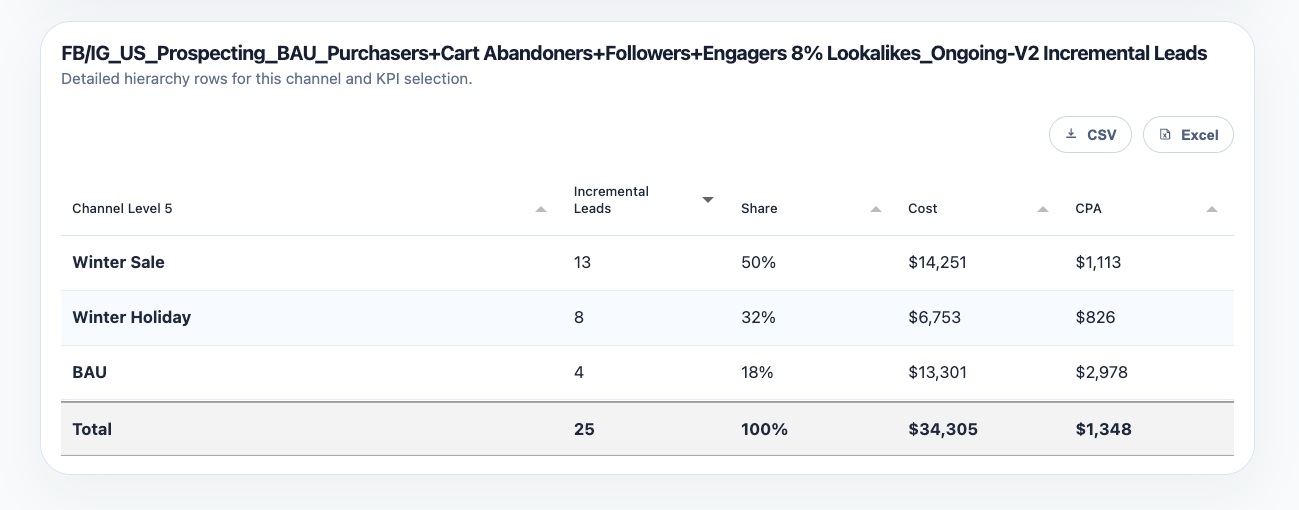
Step 4: Evaluate the detailed rows
At the most detailed level, Campaign Performance shows the hierarchy rows that actually drive the output for that selection. This is where you can identify:- the rows creating the most incremental volume
- the rows taking the most spend
- the rows with the weakest efficiency
- the rows worth protecting, scaling, reviewing, or cutting
Step 5: Go to the most granular usable level
When the source hierarchy supports it, Provalytics can continue drilling below campaign-group views into the most granular level that remains useful for analysis. In Meta, that can mean reaching the ad set level. This matters because many platforms force teams to choose between:- high-level reporting that is too broad to act on
- raw exports that are too messy to interpret in a business context
- which ad sets are carrying the contribution
- which ad sets are taking spend without enough incremental lift
- where efficiency breaks down inside what looked like a strong campaign
- which rows should be scaled, reworked, or paused
Step 6: Drill one level deeper to the ad level
When the hierarchy supports it, Provalytics can keep going beyond the ad set and show the underlying ad rows. That matters because teams often need to know whether performance differences are coming from:- audience structure
- creative variations
- offer variations
- or a small number of specific ads inside an otherwise healthy ad set
- incremental contribution
- share
- cost
- efficiency
How to interpret it well
Do not read this report as a pure efficiency ranking. A row can:- be efficient but too small to matter
- contribute meaningful volume with only moderate efficiency
- spend heavily without contributing enough incremental impact
- contribution
- share
- cost
- efficiency
- trend behavior
Assigned Value Metrics in Campaign Performance
For clients who do not have direct revenue in the model, Campaign Performance can still be viewed in financial terms through an Assigned Value Metric. Assigned Value Metric applies a predetermined dollar value to selected events, such as:- leads
- calls
- appointments
- form fills
- other non-purchase outcomes
ROAS instead of only CPA.
This is helpful when the business needs to compare channels in financial terms even though the core KPI is an event rather than a purchase.
Assigned Value Metrics are enabled by the Provalytics CSR team when appropriate for the client setup.
That combination tells you whether a row is strategically important, merely cheap, or simply expensive.
What to look for
Campaign Performance is especially strong for finding:- outsized spend with weak contribution
- rows that deserve more budget inside a channel
- demand-capture rows outperforming because other rows created the demand
- naming or structure issues that should be cleaned up in taxonomy or mapping
- the exact detailed rows where performance is breaking down or outperforming
- the specific ads or creative rows driving the difference inside a stronger or weaker ad set