Overview
Conversion Time shows how long different channels typically take to convert. This matters because not all channels work on the same clock. Some channels tend to convert quickly. Others create response that shows up later. If you judge both the same way, you can easily:- cut channels too early
- expect results before a channel has had time to work
- misread temporary softness as underperformance
What you can do
In Conversion Time, you can:- Review average days to conversion by channel
- Switch between available KPI models
- See which channels convert faster and which convert slower
- Compare conversion timing against channel impressions
- Use channel timing to set more realistic pacing expectations
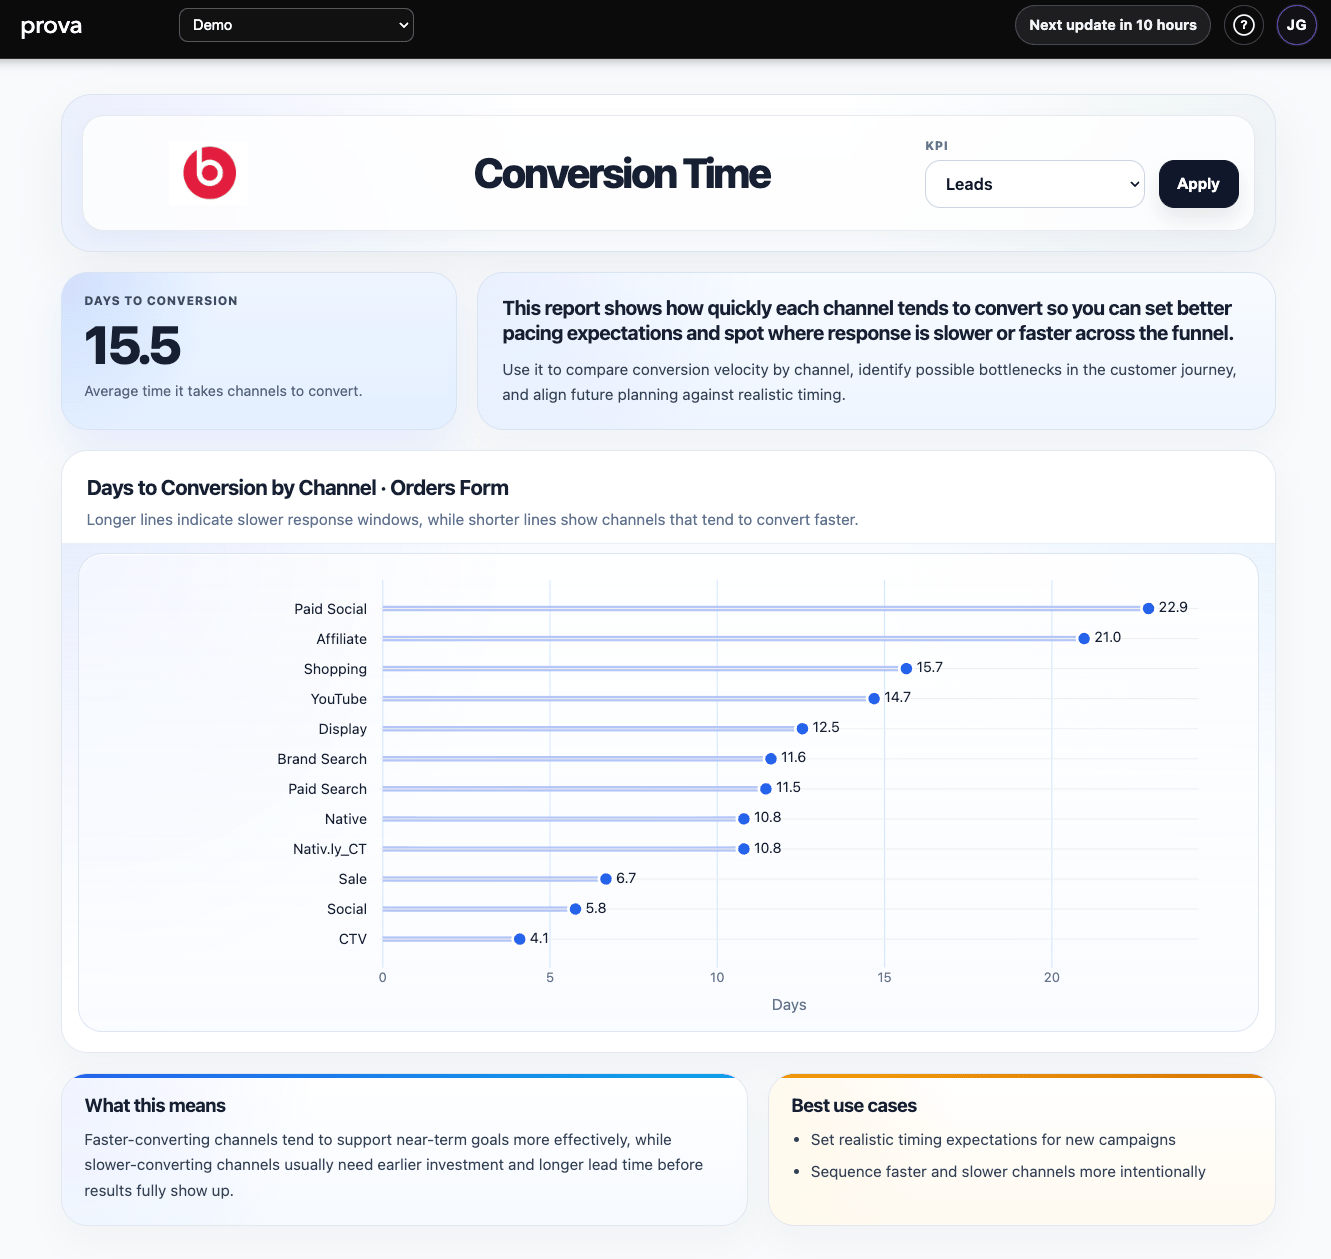
What the chart is telling you
Each row shows a channel and its expected time to conversion. In practice:- shorter bars usually indicate faster response
- longer bars usually indicate a slower conversion window
- the overall summary shows the average conversion timing across the visible channel mix
How to interpret it well
Use this report to answer:- Which channels should show results quickly?
- Which channels need longer lead time before I judge them?
- Are we pacing investment in a way that matches how the channel actually converts?
- Are we expecting a short-term response from a channel that usually works later?
A practical reading rule
Do not confuse:- fast conversion
- high incremental value
What this report is best for
Conversion Time is especially useful for:- pacing conversations
- launch timing
- expectation setting with clients or leadership
- deciding when to start upper-funnel programs before a key period
- understanding why one channel looks delayed relative to another
Why hasn’t this channel shown up yet?Often, the answer is not that the channel failed. It is that the channel has a longer response window than the team expected.
Important interpretation note
This report helps you understand timing, not whether a channel deserves more budget by itself. Use it to improve:- sequencing
- pacing
- readout timing
- planning assumptions
What the report looks like in practice
The page is built around a simple timing readout:- KPI selector
- an average-days summary card
- a short explanation of what the timing means
- a ranked chart showing channels from slower to faster conversion
- interpretation and use-case panels at the bottom