Overview
The Incrementality Report is where Provalytics turns measurement into a clear business question:Which channels and campaigns are actually changing the outcome?This report helps you separate:
- demand that marketing created
- demand that marketing captured
- outcomes that likely would have happened anyway
What you can do
In the Incrementality Report, you can:- Review incremental contribution by channel
- Drill into campaigns
- Filter by date range
- Compare contribution and efficiency
- Export results for analysis or reconciliation
What the report looks like in practice
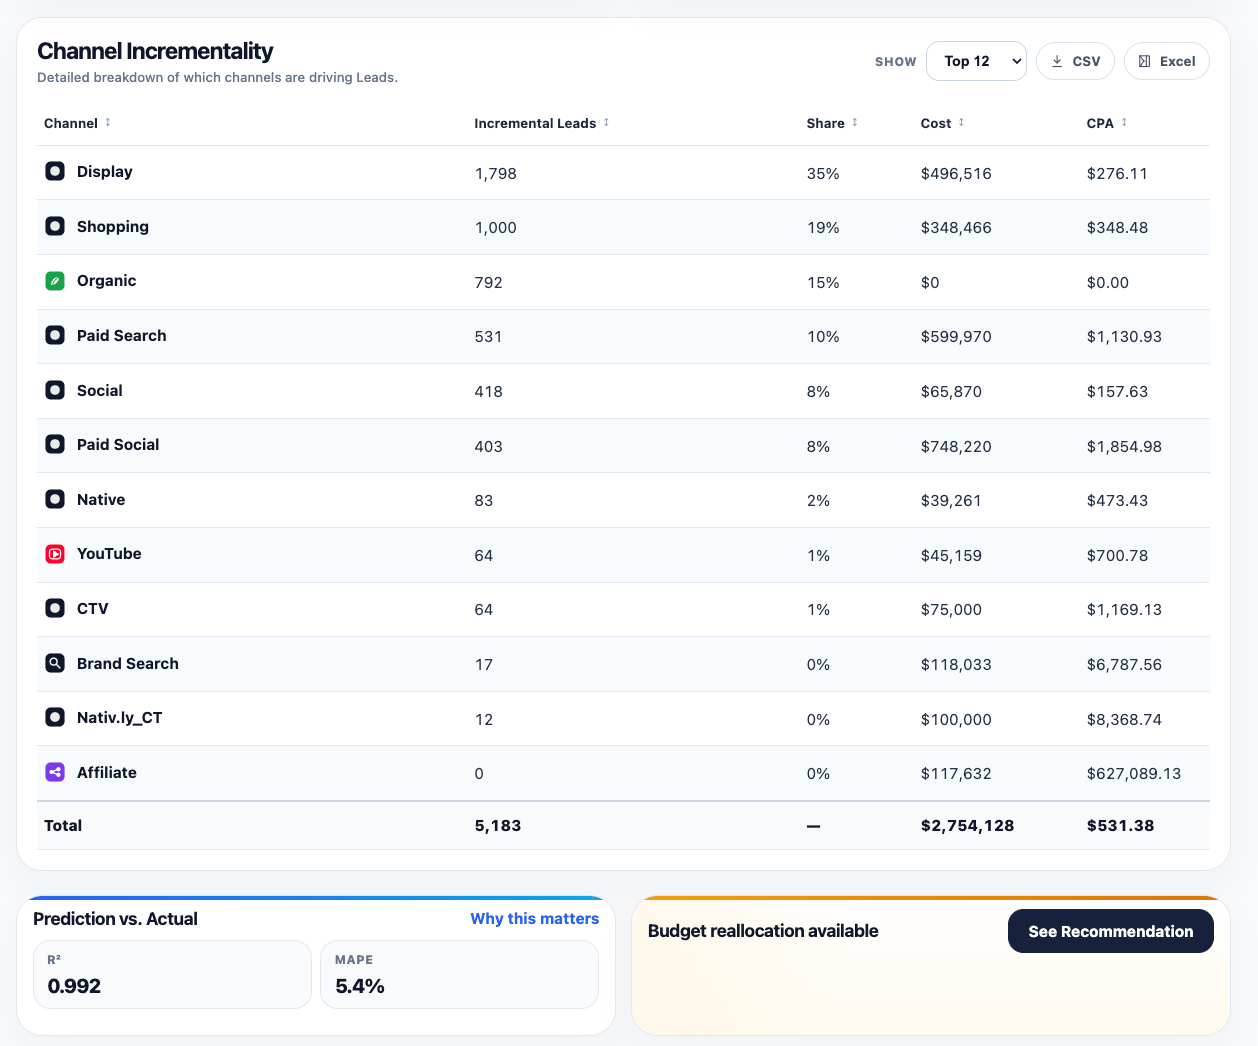
The core view is a ranked channel table that puts contribution, share, cost, and efficiency side by side. That makes it easy to see:- which channels are driving the most incremental volume
- which channels are consuming the most budget
- where efficiency is strong or weak
- whether contribution share and spend share are aligned
- is the model validation strong enough to trust the output?
- is there an immediate optimization action available from recommendations?
How to interpret it
Incremental contribution is not the same as platform attribution. Platform attribution answers:What did the platform claim credit for?Incrementality answers:
What did this marketing activity actually add?That is why the report is especially useful when:
- upper-funnel channels look weak in click-based reporting
- search appears stronger than expected
- direct traffic or branded search seem to absorb demand created elsewhere
- leadership wants a view grounded in business impact rather than platform logic
- Incremental contribution
- Spend
- ROAS or CPA
- Channel share
- Trends over time
- Halo effects where available
- the top contributing channels
- the channels with the largest spend
- the biggest efficiency outliers
A practical reading rule
Do not read contribution in isolation. A channel can:- contribute a large share of incremental impact with moderate efficiency
- look efficient but remain too small to matter at the business level
- appear weak on direct conversion while still creating meaningful downstream demand
Why this report changes budget conversations
Without incrementality, teams often optimize toward the channels that are easiest to report. That tends to favor:- demand capture
- short-path conversions
- platform-reported success stories
- finance
- leadership
- clients
- planning teams deciding where the next budget move should go