Overview
True Impact separates media-driven lift from the portion of the outcome that likely would have happened anyway. This is one of the clearest ways Provalytics helps teams move beyond:- platform credit
- channel vanity
- total outcomes without context
How much of this result was really created by media?
What you can do
In True Impact, you can:- select a KPI
- filter the date range
- see monthly separation between organic/base demand and media-driven impact
- understand how much of the outcome appears to be driven by paid media versus underlying demand
What the report is showing
The report compares:- Organic/Base: the portion of the outcome that likely would have occurred without the visible paid-media contribution in the measured window
- Media Impact: the portion of the outcome that appears to have been driven by media
How to interpret it well
True Impact is especially useful when:- a business outcome is growing but you need to know how much marketing is actually responsible
- leadership wants to understand “what would happen if we turned media off”
- teams are comparing paid-media contribution against underlying brand or market demand
A practical reading rule
Do not read total conversions, revenue, or sessions as proof that media created them. True Impact helps distinguish:- the outcome that would likely have happened anyway
- the portion that appears to have been added by media
What this report is best for
Use True Impact when you want to:- explain true media contribution in plain language
- defend why total outcomes alone are not enough
- understand whether growth is mostly market/base-driven or media-driven
- compare months where media influence strengthened or weakened
Important interpretation note
True Impact is not a replacement for incrementality or campaign analysis. It is a framing tool that helps answer:How much of the observed outcome was already there, and how much appears to have been driven by paid media?Use it alongside:
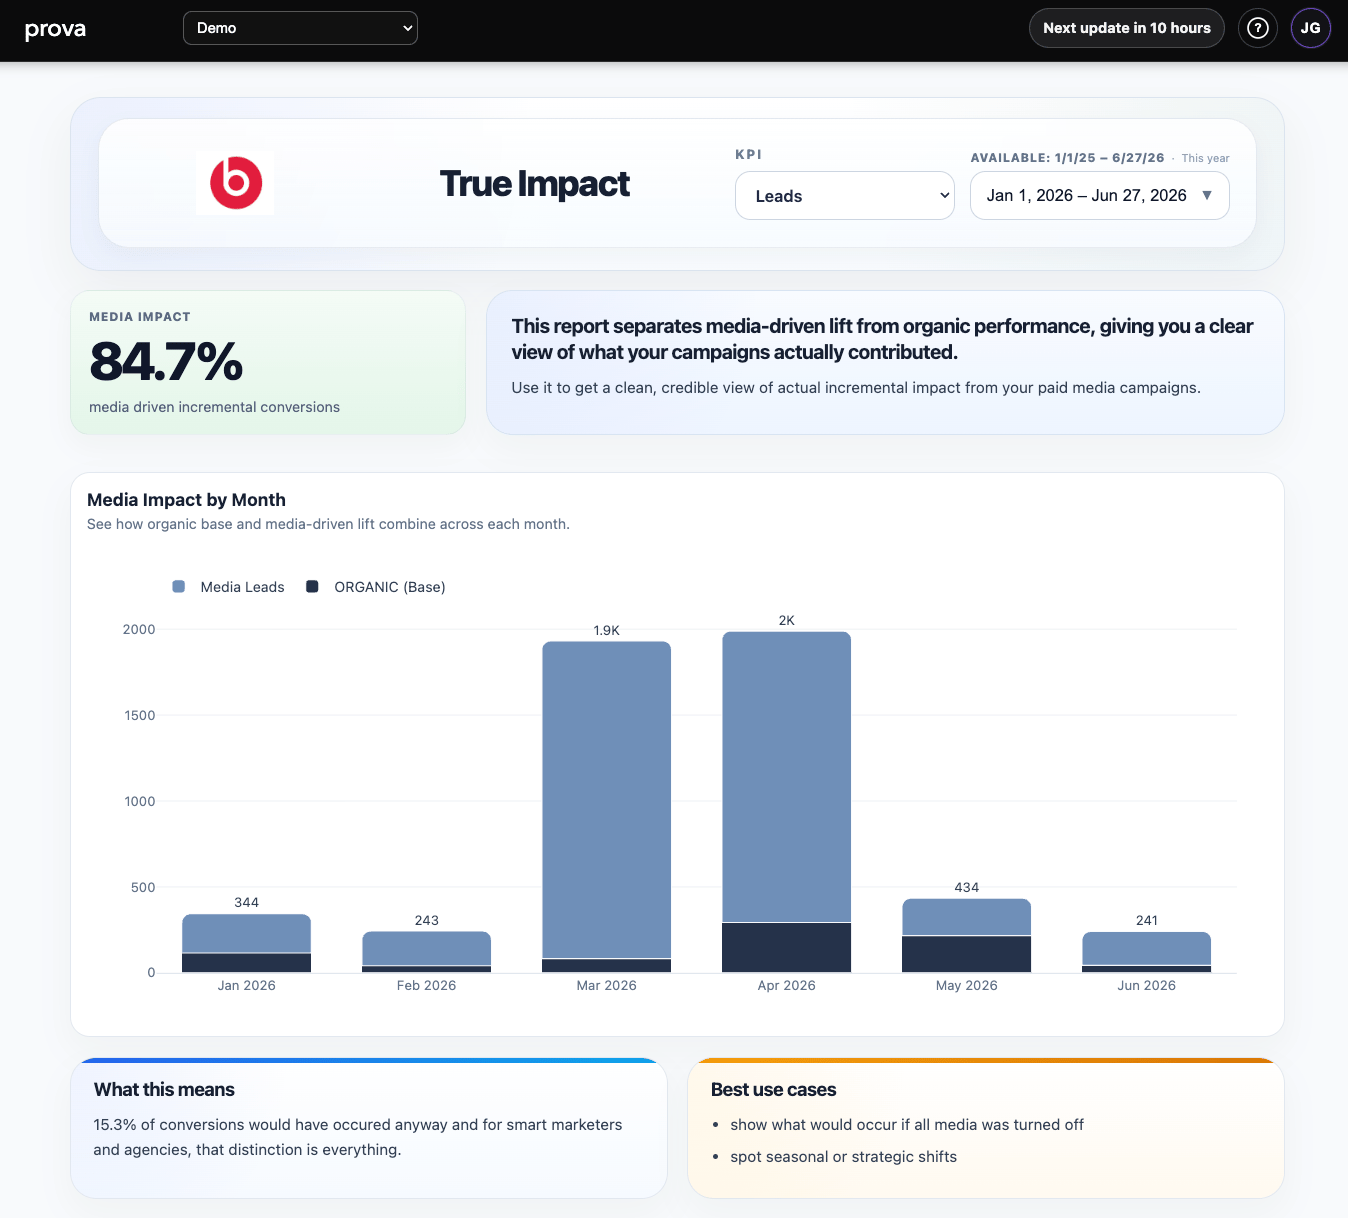
What the report looks like in practice
The page is built to answer the “what would have happened anyway?” question in one view:- a headline
Media Impactcard - a clear explanation of what the percentage means
- a monthly chart showing organic base and media-driven impact together
- interpretation and use-case panels at the bottom